
Valuing Draft Pick Protections
IND-LAC, draft slot values, future standings projections, and.... structured finance?

The LA Clippers recently sent Ivica Zubac and Kobe Brown to Indiana for Bennedict Mathurin and Isaiah Jackson, plus three draft picks:
2026 IND 1st — Protected 1-4 and 10-30. Only conveys to LA at picks 5-9. If it doesn’t convey, it becomes an unprotected 2031 first.
2029 IND 1st — Unprotected.
2028 DAL 2nd — Unprotected.
I’m pretty intrigued by the 2026 pick protection structure.

It creates a narrow zone of conveyance for the Clippers, and with the NBA’s lottery structure, removes any certainty the Pacers could have in keeping the pick.
With this deal as inspiration, I wanted to think through valuing different pick protection structures. The following walks through building a pick value curve, projecting where future picks will fall, and how protections can modify expected value.
Draft Pick Value
To value protections, we need to value picks first. There are a few parts to this: (1) valuing draft slots, (2) projecting a team’s future draft slots, and (3) calculating some expected value based on (1) and (2).
I’m certainly not the first to try the valuing draft slots thing. There’s this from Aaron Barzilai, 2015 piece from Kevin Pelton, this 2017 follow-up from Kevin Pelton, this chart from Jacob Goldstein, and this freakin’ book by Tony ElHabr. I’m sure I’m missing other great sources on this topic, too.
Mostly for fun (and learning), I decided to give it my own go.
The Data
I used Estimated Plus-Minus (EPM) covering seasons from 2001-02 through 2024-25. For every player drafted in this time period, I compute the cumulative estimated impact above replacement:
Cumulative Impact = Σ ((EPM - replacement level) × minutes) across a given time period
I used -2 as the replacement level for EPM, pretty much just because people on the internet said that’s what it is. We multiply by minutes to try to turn the rate stat into a volume stat.
The time periods I decided to focus on are 4 years (up until the first major contractual decision point) and 7 years (approximately the second major contractual decision point). We have 21 draft classes of data for the 4-year group, and 18 for the 7-year group.
The Curve

The raw slot curve is pretty noisy, but the general shape is there. There’s a steep drop from picks 1-5, then a long tail that flattens out. The confidence intervals are wide throughout — you may pick LeBron James #1 or you may pick Anthony Bennett.
To get some usable values for each slot, we need a curve that smoothes out the noise. The empirical curve looks like a log function, so I used the form V(pick) = a × log(b / pick) + c. A weighted least-squares optimizer starts with a guess, checks how far the curve is from the 30 slot means, and keeps adjusting until it finds the combination that minimizes total error.
The result for the 4yr window: V(pick) = 95.4 × log(32 / pick) + 39.
For the 7yr window: V(pick) = 167.0 × log(40 / pick) + 76.

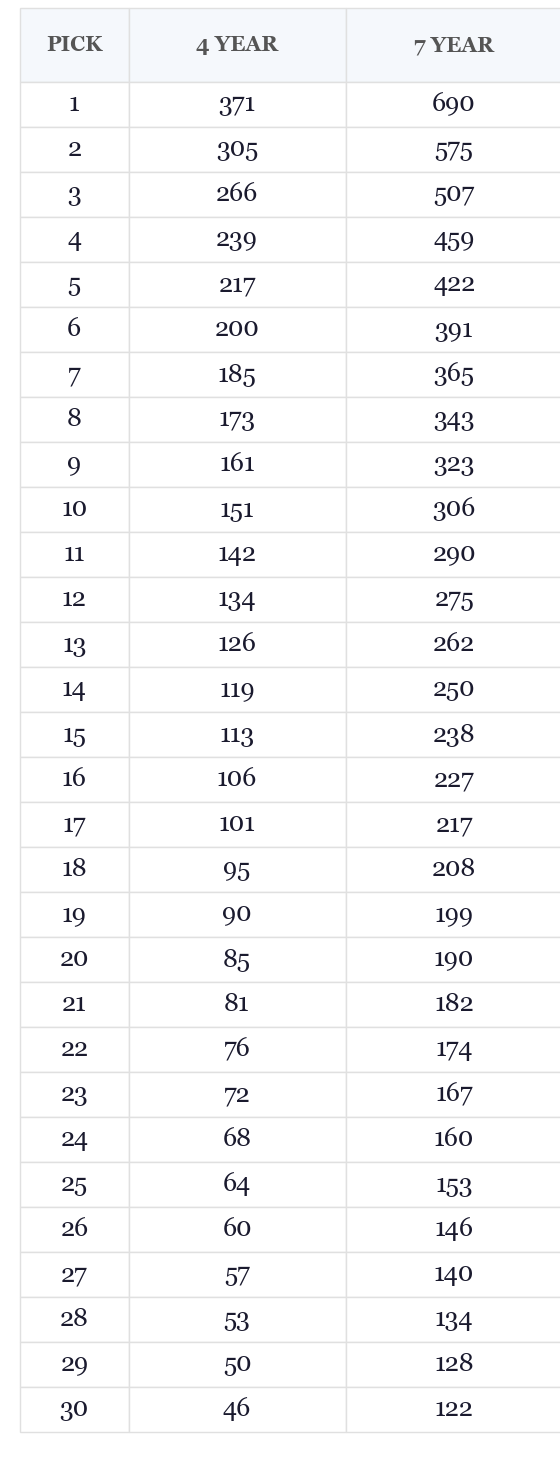
Here’s a look at our values in numerical/table form:
Future Pick Projections
Ok, so we have some values we can assign to draft slots. How do we then figure out which draft slots Indiana might occupy in the future? Let’s go year by year.
2026
Indiana is 15-40 with 27 games remaining. Using basketball-reference’s projected remaining records, I took the Pacers’ projected remaining win rate for each team, simulated each team’s remaining games 50,000 times, ranked the league in each simulation, and applied the lottery odds to the resulting rank distributions. This is a little back-of-napkin-mathy, but I think it gets us close enough to explore the main idea about protections.

Based on the above, Indiana is most likely to pick 6th or 7th (which means they lose the pick). Here’s a look at the probability they keep vs. lose the pick:
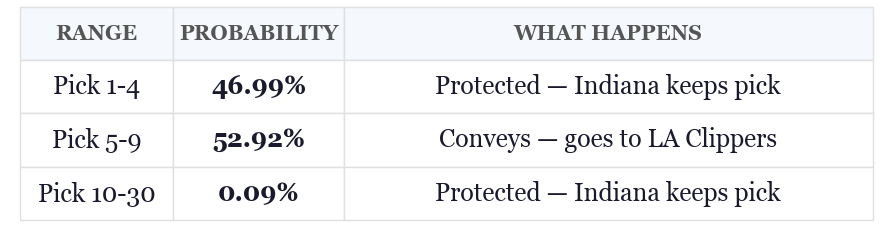
Pretty close to a coin flip!
2029 and 2031
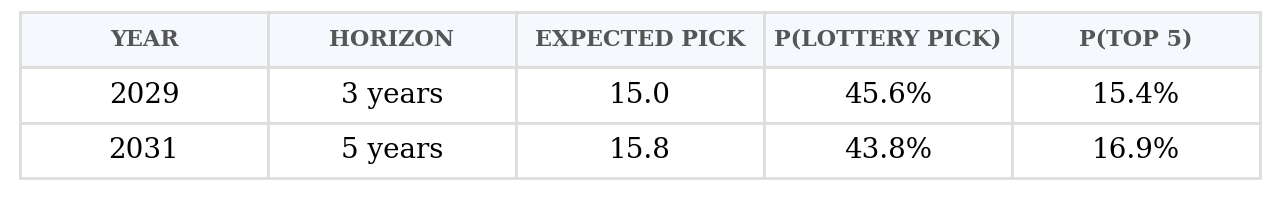
For picks further in the future, we can use the data from the historical standings distributions we explored a few months ago:

For the 2029 and 2031 picks, we have to look 3-5 years ahead (spoiler: there’s generally tons of noise looking ahead more than two years). After running Indiana's current rank through a Markov chain built from 20+ years of historical standings data, the model returns an expected pick of... 15. Right in the middle of the draft. There are two ways to read this: (1) my projection model sucks (probably!), or (2) it’s really hard to tell who will be good three+ years from now (probably!).
There’s probably a good argument for reducing the smoothing and allowing for more noise. Maybe something I’ll explore soon.

Valuing Picks
For an unprotected pick, valuation is straightforward. You have a probability distribution over where the pick will land (P(pick=k) for each slot 1 through 30), and a value curve that tells you what each slot is worth (V(k)). The expected value is just the probability-weighted sum:
EV = Σ P(pick=k) × V(k)
For a protected pick, some slots don’t convey. The pick only has value to the acquiring team in the slots where it actually transfers. So you split the calculation: sum across the conveying slots, then add the expected value of whatever fallback kicks in if it doesn’t convey.
EV = Σ P(pick=k) × V(k) for all k where the pick conveys, plus P(doesn’t convey) × EV(fallback)
The fallback is usually another pick in a future year, or second-round picks in the same year, which you value the same way.
Time Discounting
I struggle with this part.
All else equal, would you rather have the #1 pick today or the #1 pick in 2031? Probably today, right? You get the player sooner, start his rookie-scale clock sooner, and begin competing sooner. And, if you’re a GM, you usually can’t afford to sit and wait for 2031 to come around. That’s the basic intuition behind discounting future picks.
But there are counterweights. Future picks are easier to move in trades. They’re more liquid than a pick that’s about to convey. They carry no present-day cap hit. These factors push back against heavy discounting.
There’s another important time-related factor touched on above: it’s really hard to project team performance far into the future. That uncertainty is baked into our expected value calculation. But if you factor it into a discount rate, too, then you’re double counting it.
So, ideally, the discount rate should only capture time preference: the straightforward idea that having something today is better than having the same thing later. What is that rate? I sort of have no idea. I present a few options below, and I think it’s probably in the 3-6% range, but that’s just a guess (if you have a good way to approach this empirically, I’d love to know!):

Indiana’s Picks
With the above in mind, let’s take a look at the value of the first-round picks that Indiana traded, using a 3% discount rate.
2026 1st (Protected 1-4, 10-30)
P(conveys at 5-9): 52.9%
P(doesn’t convey → 2031 fallback): 47.1%
Conveying EV: 103.8 — probability-weighted across picks 5-9, no time discount (draft is this summer). When it conveys, the Clippers get picks ranging from V(5)=217 to V(9)=161.
Fallback EV: 53.2 — this includes the 47.1% probability that the fallback activates and the 5-year time discount.
2029 1st (Unprotected)
Moderate time discount (3 years, discount factor 0.91 at 3%).
Expected pick: 15.0 — with substantial spread across lottery and non-lottery outcomes.
Raw EV: 135.0 / Discounted EV: 123.2
All Traded Firsts:
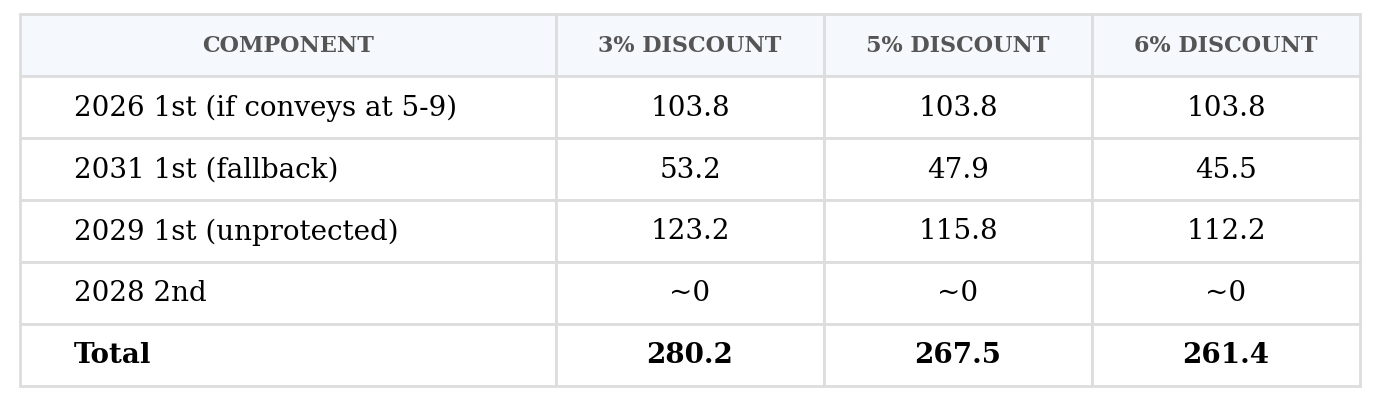

I’m not putting these values here to try to determine whether Indiana offered fair value for the return. That’s another question. I’m more interested in comparing the individual assets that Indiana offered (and could’ve offered). Here are the values of some alternative protections that Indiana could’ve put on the table:

We could add endless possible protection schemes and combinations. The above just shows a few the are either common or interesting to me.
Power of Protections
All this leads us to what I think is the main takeaway from this deal: protections are a way to slice the value of an asset.
This isn’t a novel idea, either. It’s pretty common in the world of finance. Imagine you have this thing that generates future cash flows. But you want money right now. You can slice it up and sell it to buyers with different risk tolerances. One buyer gets the risky upside, one gets the steady middle, one gets whatever is left. The underlying asset hasn’t changed, but the pieces can be worth more (or less) than the whole, because different buyers value different slices differently. This is, roughly speaking, how mortgage-backed securities work, how insurance works, and how stock options work.
I can see a world where draft pick protections are the NBA's version of this (more than they already are). An unprotected first-round pick is the whole asset — all 30 possible outcomes bundled together. A protection carves it into tranches. Imagine slicing a single pick into five bands and selling each one separately:

Of course, it’s hard to know what the return for each tranche would be. But, I’d imagine for a pick far enough in the future, Tranche A gives enough reward to return a decent asset in the immediate term. At the very least, the more a team can slice an asset, the more flexibility they have. Especially when short on assets.
There are certainly Stepien and other restraints worth factoring in. But I merely present the general idea as something to explore. Draft picks are valuable for a lot of reasons. It might be overlooked how malleable their value is.
I’d recommend checking out Travis Chen’s work on a similar topic: Exotic Picks; Valuing NBA Draft Trade Assets Programmatically.
It's cool to see how the Pacers engineered the protection to be as close to a coin flip as possible. It seems like they would want to not land 5-9 because that means they get a top 4 pick (super valuable this year in particular) while only giving up a value-nebulous 2031 pick. I like Zubac to fit in their late-2020s window, but I think the deal could age poorly for them if the coin flips in LAC's favor.
The time discounting thing got me thinking of a possible way to do it empirically. Maybe you could blend the work you cited from a few months ago into this? Since in 5 years' time every team's standing prediction falls towards the middle (15), I'd imagine the value of picks over time would fall at a rate higher than 3% or 5% since the uncertainty seems to increase quite a bit in just a few years. Though like you mentioned, the liquidity of those picks could up their value as a result of all that, and I'm not sure how you could factor that in empirically. Maybe look at how freely teams have been willing to trade picks in the past based on year? E.g., how liberal do teams tend to be about trading picks in year n+4 vs year n+1, potentially factoring in the value involved in those trades (EPM?).
Lastly, this all got me thinking about the current lottery system. This piece serves as another reminder of the precipitous decline in value after the first handful of picks, which makes me wish the lottery wasn't as large as 14 teams. I feel like a system which includes only the bottom 10 at maximum (so no play-in teams) with flat odds could work. That way you're either fighting for the playoffs or you get a top 10 pick at random. Then since the lottery odds would be uniform, tanking wouldn't be as incentivized (any weight favoring top picks will always incentivize tanking). But a fan can dream.
In order to accurately estimate the value of a future pick, I don't think you can run a model that uses every team as the sample. I think you have to limit your sample to *teams that don't have control over their draft pick*
I think that sample would both change the expected placement in the standings and the distribution.